Finviz Stock Screener
Elite Review & Premarket Setup
A real-time stock screener and heat map tool that's part of my actual morning routine, before I ever open a charting platform. Here's what it does, what I use it for, and what the trial really costs if you forget to cancel it.
Finviz (Financial Visualizations) is a web-based stock research and screening platform. Its core tool is a screener that filters the entire US stock market by dozens of technical and fundamental criteria — float, relative volume, gap %, price range, chart patterns, sector — down to a precise watchlist in seconds. The platform also includes heat maps, insider trading data, news feeds, and basic charting. The free tier requires no signup and is genuinely useful; the Elite plan unlocks real-time data, premarket and after-hours quotes, alerts, API access, and CSV export. This page covers Elite specifically — if you're on the fence, skip to the pricing table below before deciding.
I run a Finviz scan most mornings as the first step in building my own watchlist — well before I ever touch a chart. It's fast, it's filter-rich, and for narrowing thousands of tickers down to a short, relevant list, I haven't found anything quicker. This page covers the Elite plan specifically, since the free tier's delayed data isn't useful for anything happening in real time before the open.
Finviz's 7-day free trial of Elite requires a credit card upfront. You won't be charged during the trial, and you can cancel anytime before it ends — but if you forget, it automatically converts to a paid subscription at $39.50/mo (or $24.96/mo if you selected annual billing) using the card you provided at signup. A 30-day refund is available if you do get charged and want your money back. Worth setting a calendar reminder for day 6.
Real-Time Data & Premarket Access
The free tier runs on a 15-minute delay — a dealbreaker for anything happening in the premarket session. Elite gives real-time quotes plus premarket data starting at 4:00 AM ET and after-hours data through 8:00 PM ET. During those premarket hours, the screener runs on live data — filters like relative volume, gap %, and current volume reflect what's actually moving before the open, not what happened 15 minutes ago. For catalyst plays where stocks gap 30–50% before 9:30 AM, that's the whole game.
Advanced Screener Filters
70+ fundamental and technical filters — float, relative volume, gap %, price action, and dozens more — stackable into a saved scan you can re-run every morning in seconds.
Export & API Access
Screener results export to CSV, and Elite includes API access — useful if you're piping results into your own tools rather than just reading them on the page.
| Feature | Free | Elite Monthly | Elite Annual |
|---|---|---|---|
| Price | $0 | $39.50/mo | $24.96/mo (~$299/yr) |
| Screener filters | 60+ | 70+ | 70+ |
| Data | 15-min delayed | Real-time | Real-time |
| Premarket & after-hours | ✘ | ✔ 4:00 AM–8:00 PM ET | ✔ 4:00 AM–8:00 PM ET |
| Real-time alerts | ✘ | ✔ | ✔ |
| CSV export | ✘ | ✔ | ✔ |
| API access | ✘ | ✔ | ✔ |
| Backtesting | ✘ | ✔ Daily timeframes only | ✔ Daily timeframes only |
| Signup required | ✘ No signup needed | ✔ Card required for trial | ✔ Card required for trial |
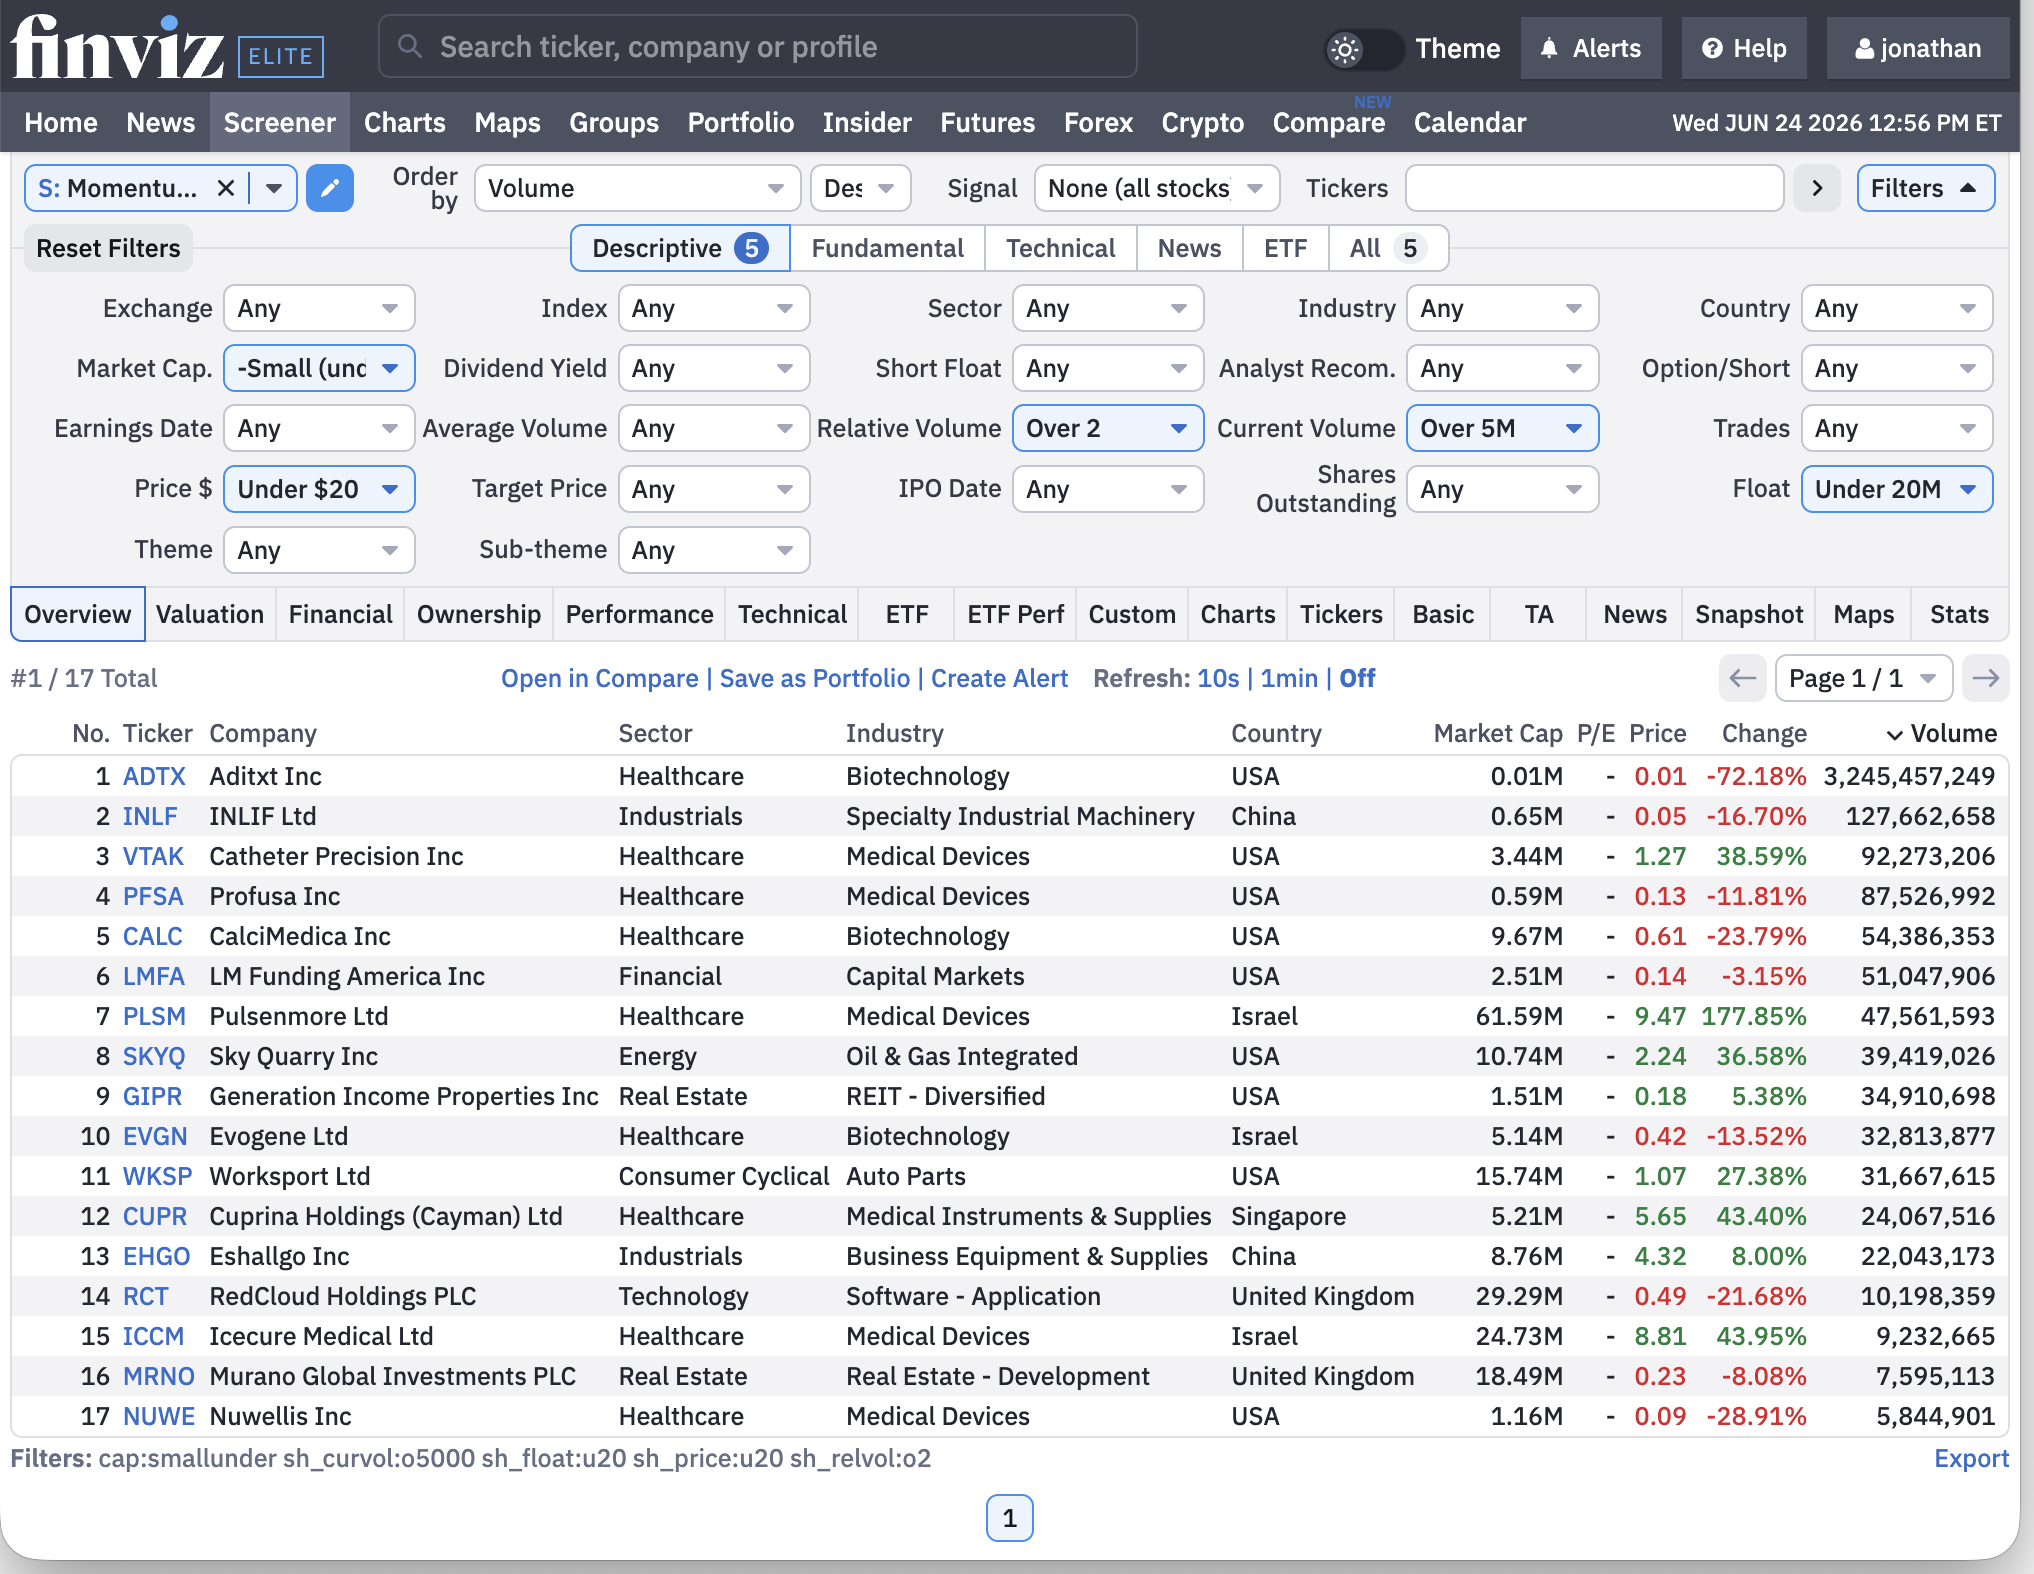
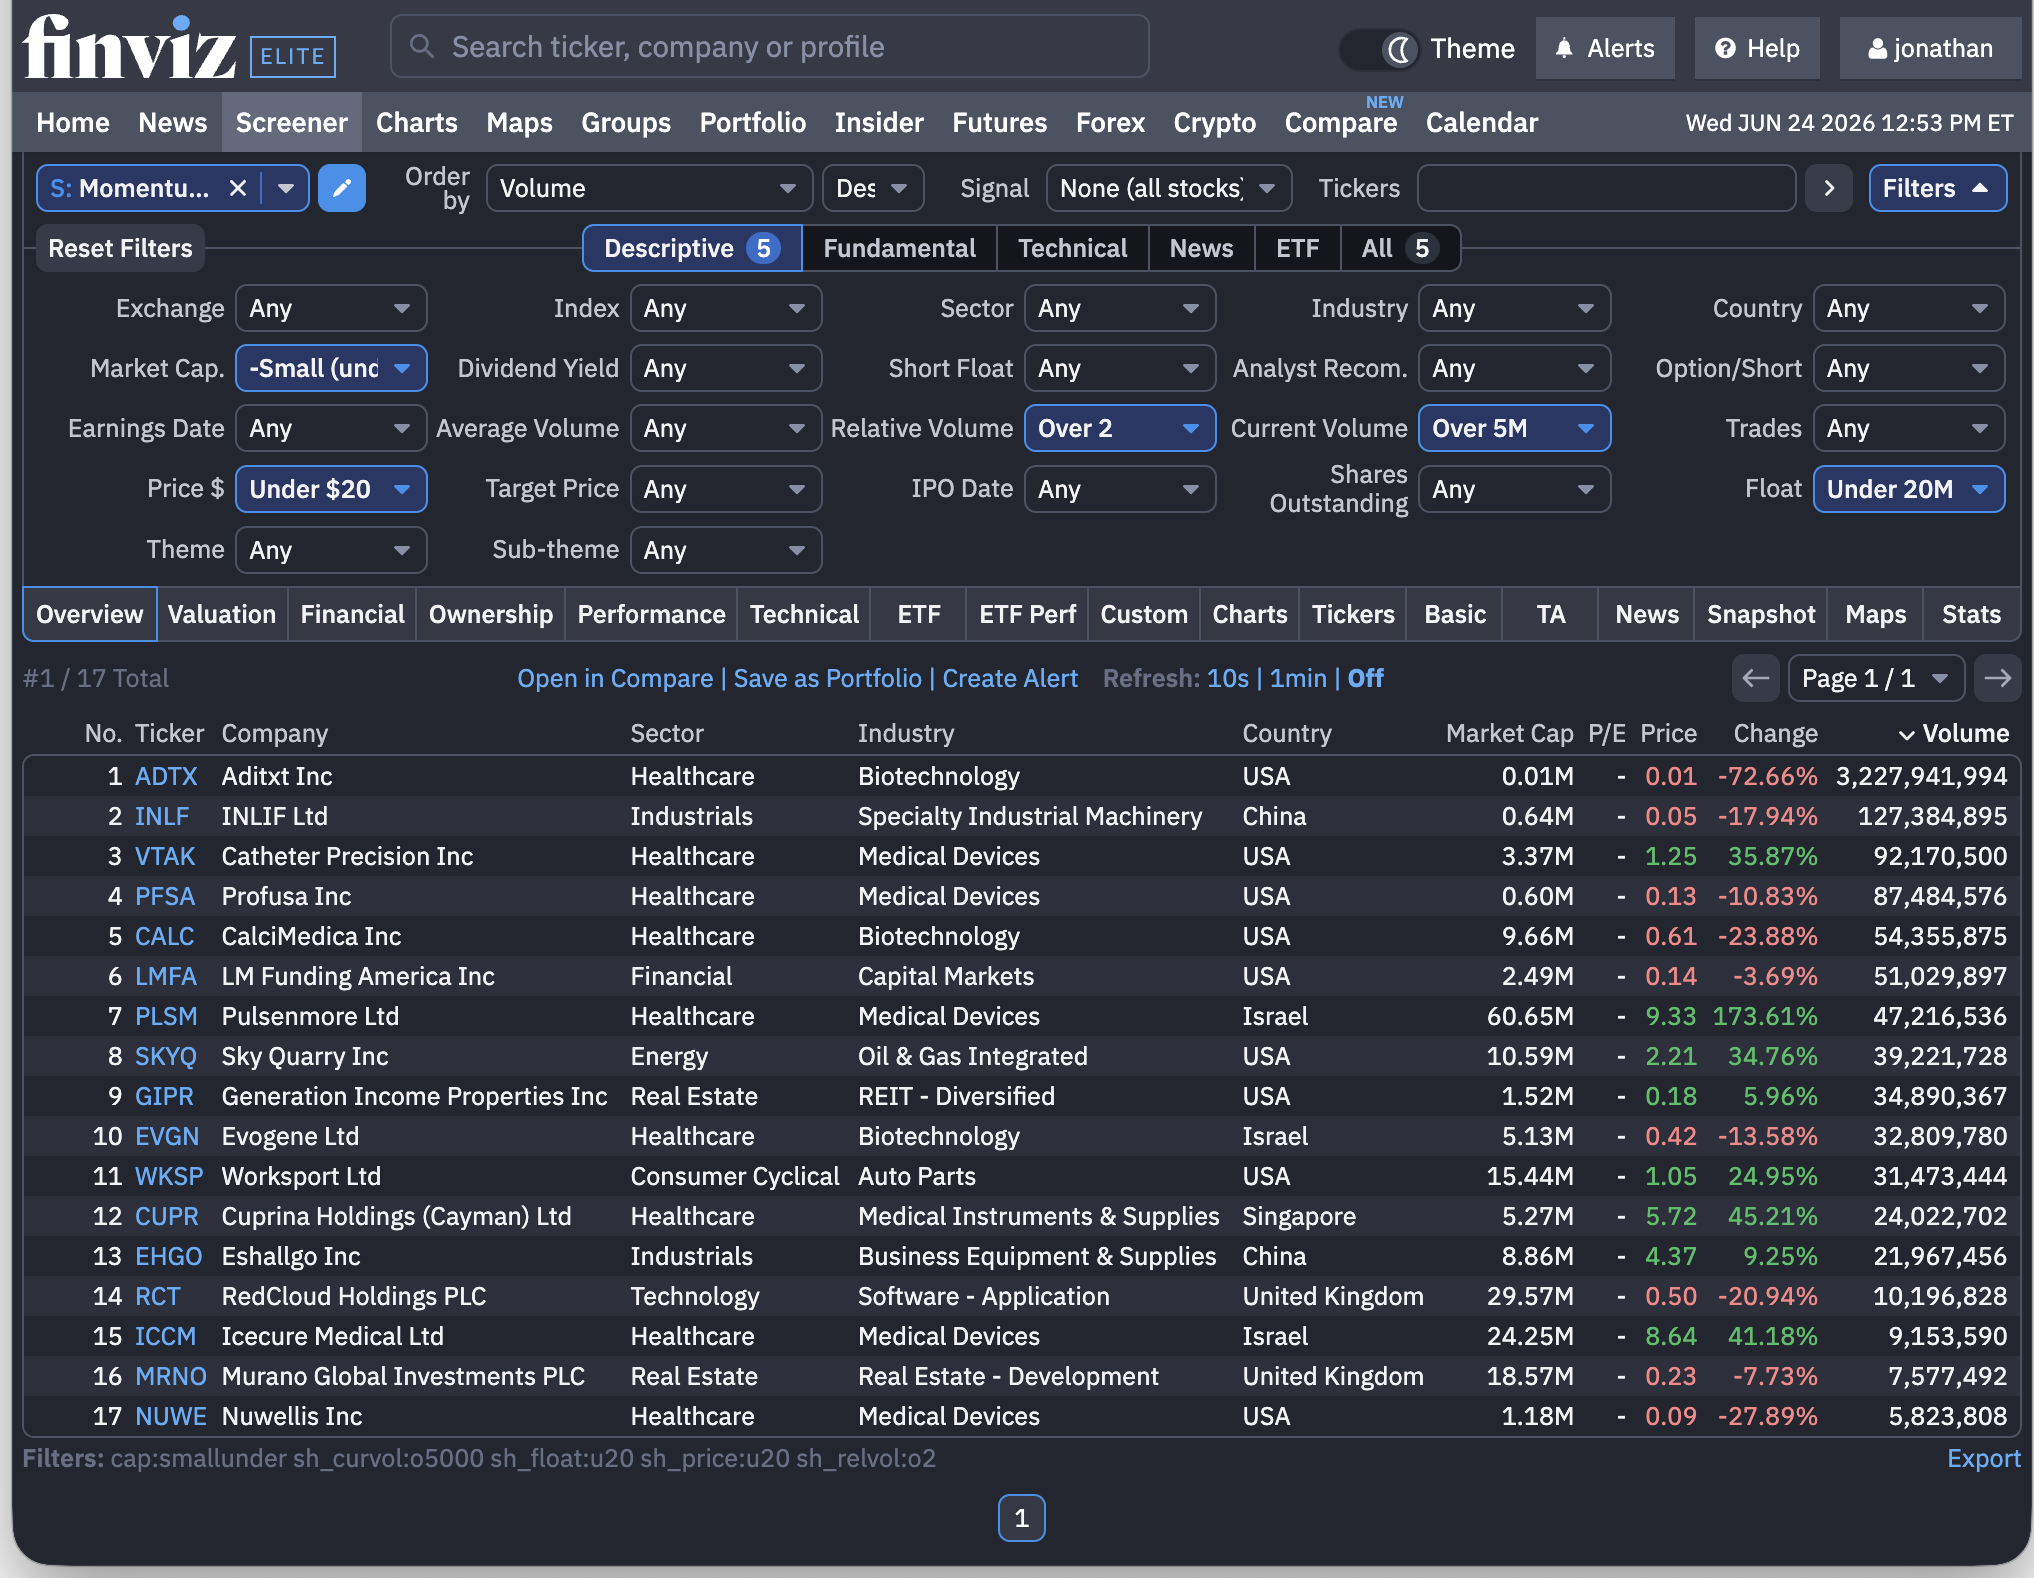
Every morning before the open, I run a saved Momentum scan with five filters stacked together:
- Small / micro-cap
- Price under $20
- Float under 20 million shares
- Relative volume over 2×
- Current volume over 5 million shares
Sorted by volume, descending. On a typical morning that narrows the entire market down from tens of thousands of tickers to roughly 15-20 names. That's it — there's no secret sixth filter. The screenshots below are the actual results from a real run, not a mockup.
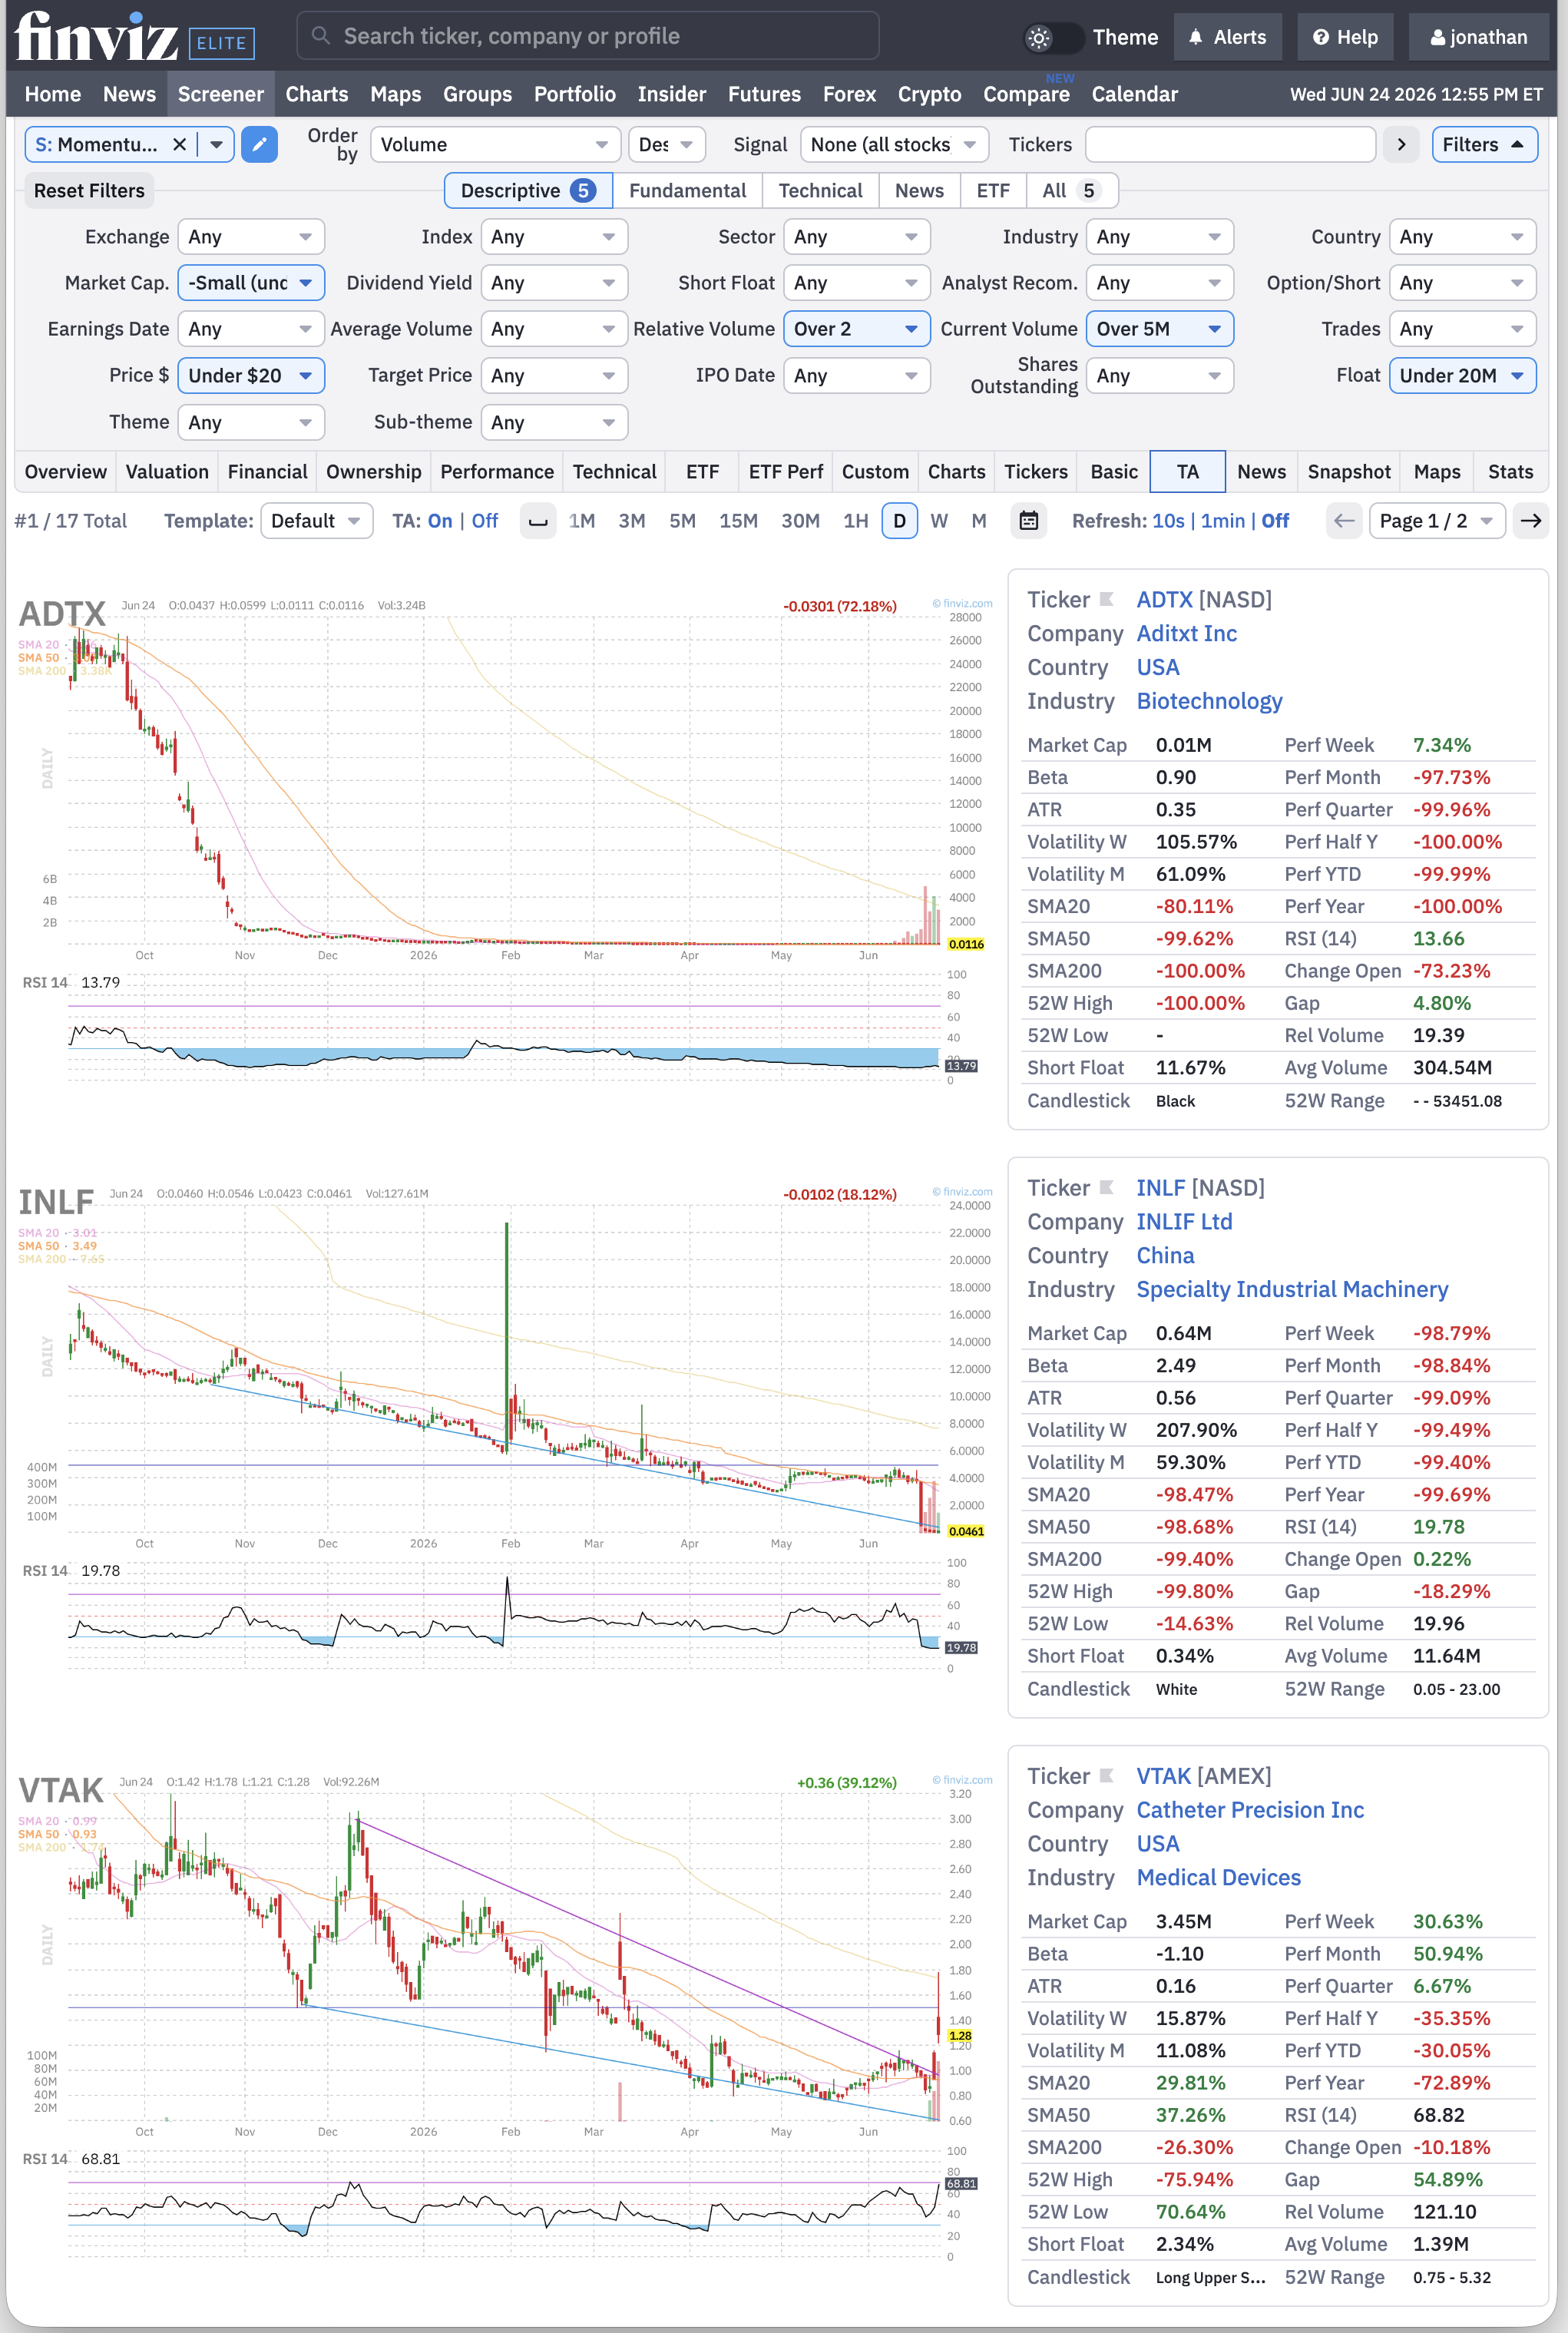
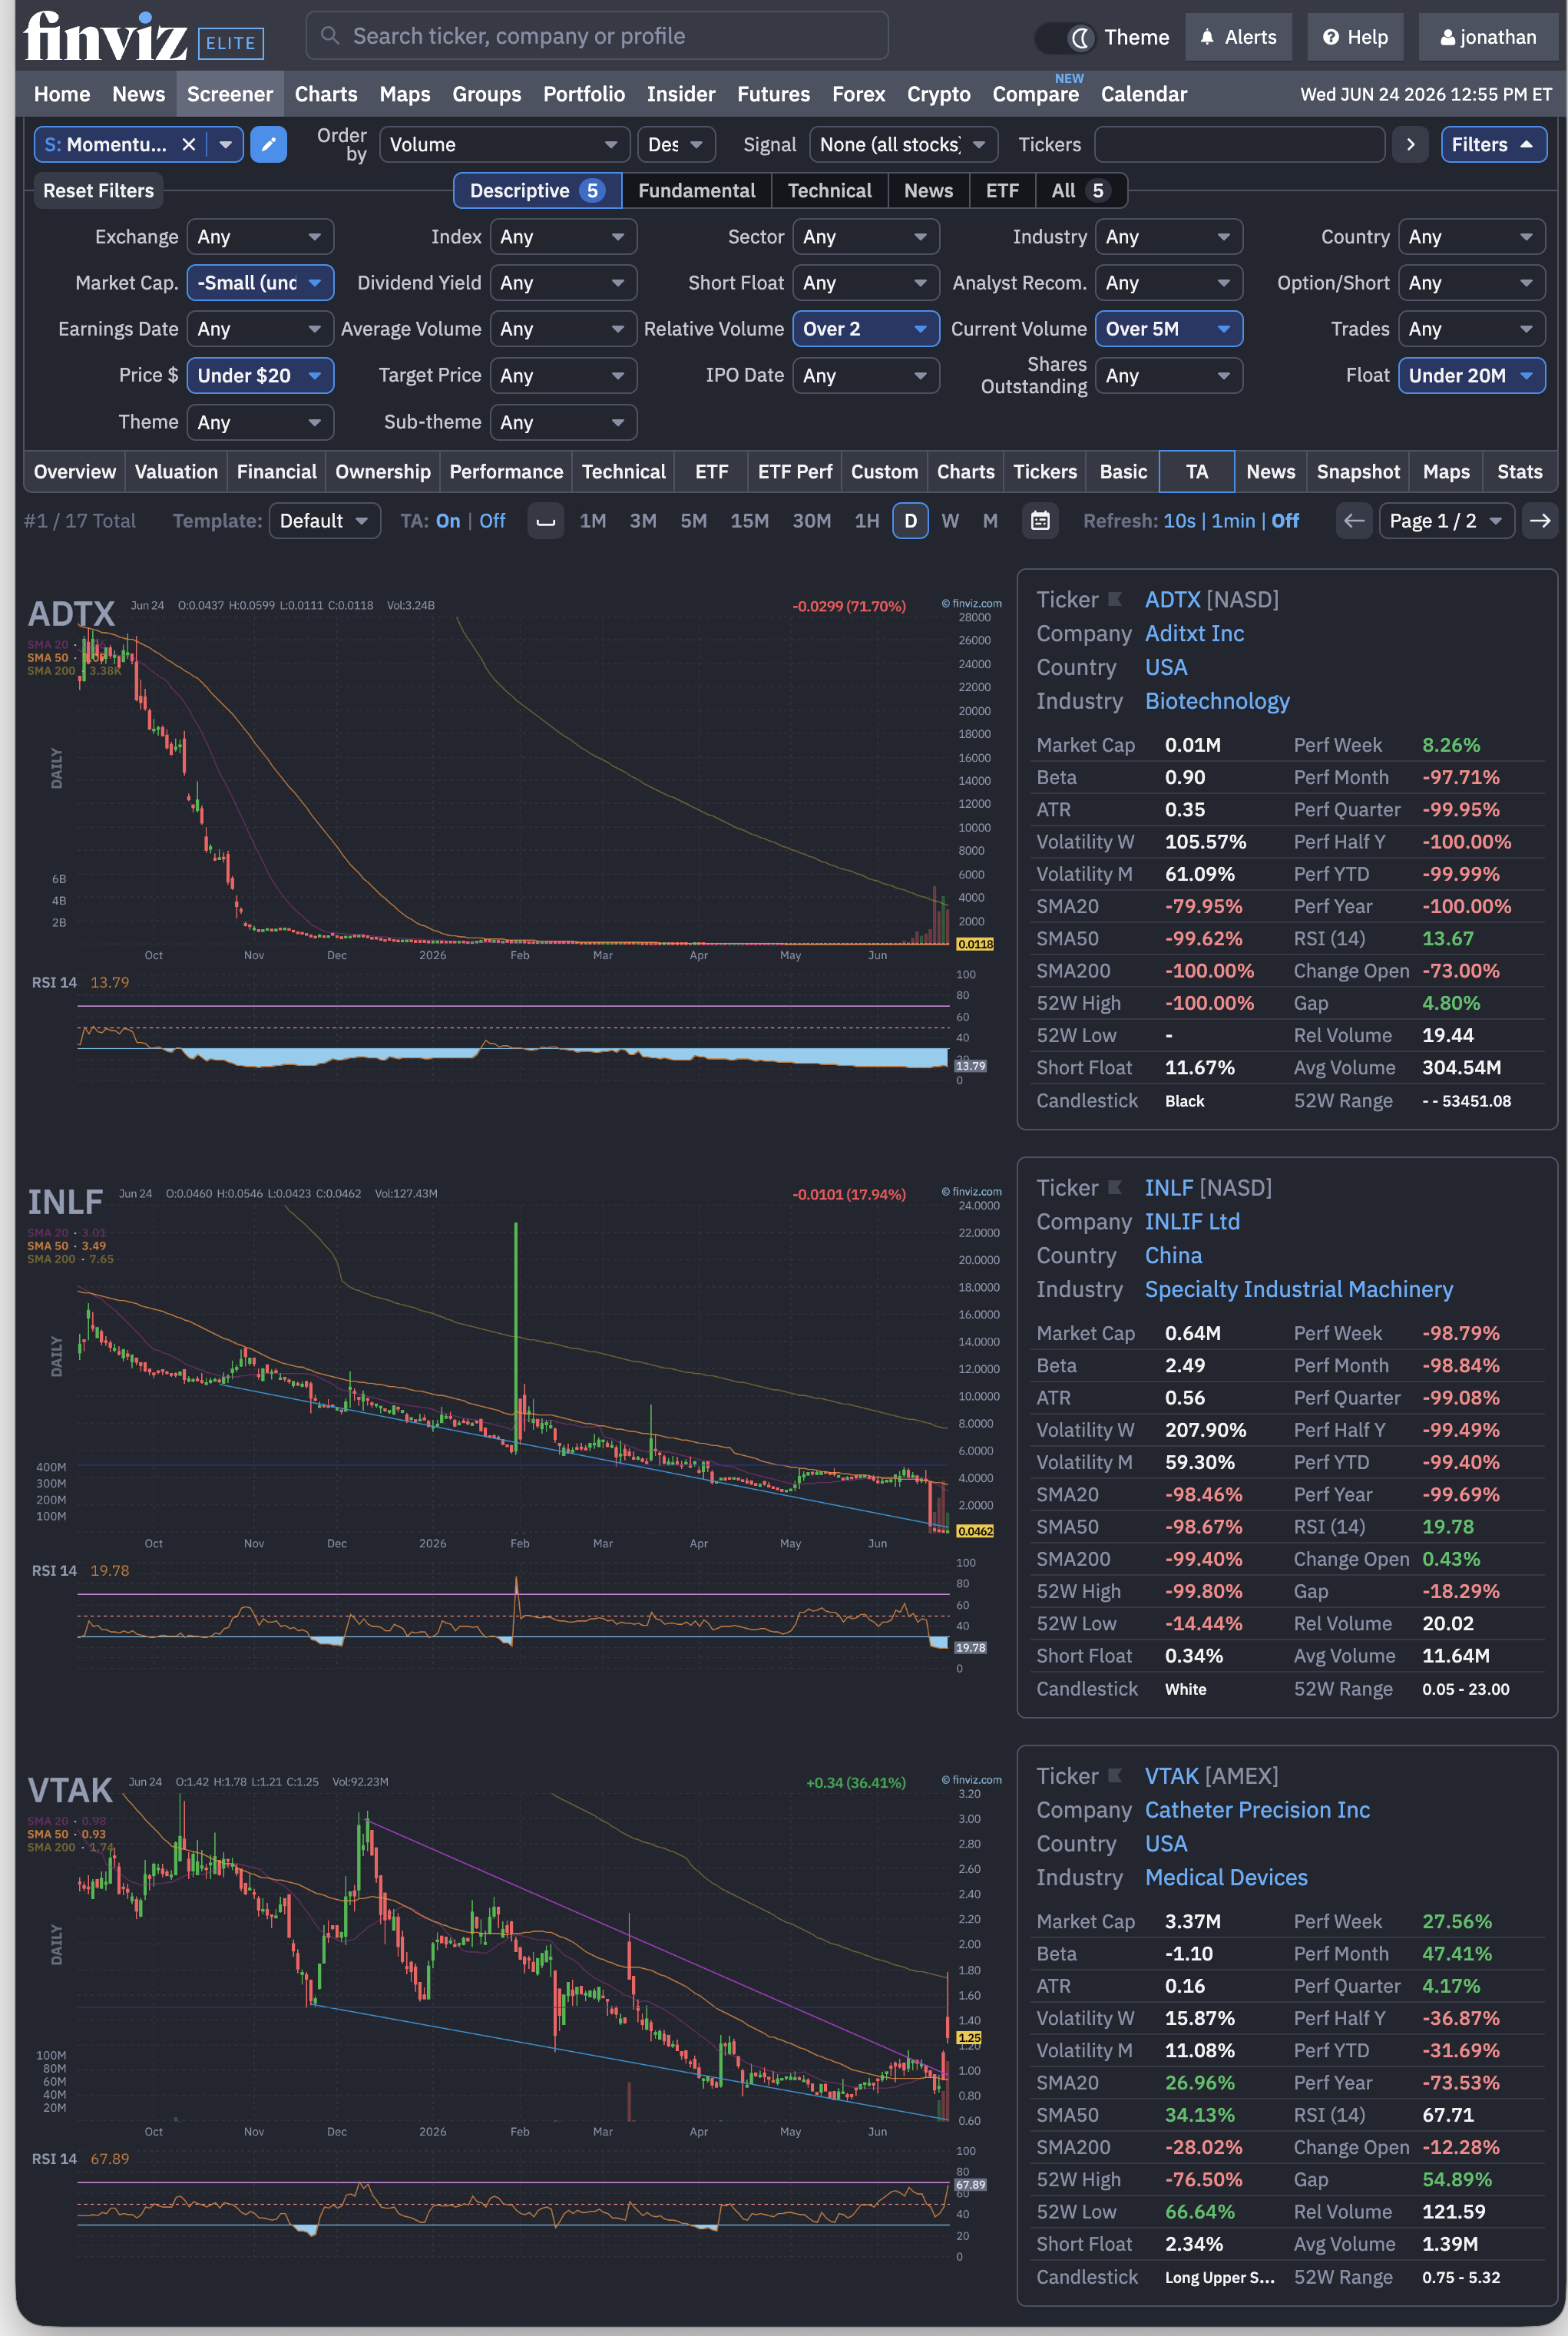
- This filter set narrows the entire market down to roughly 15-20 names that might be attractive to scalp — sorted by volume, not by quality.
- Many of these are genuinely garbage companies, and that's not an oversight — it's exactly the kind of name that moves enough, fast enough, to scalp.
- A trade on one of these can last seconds to a few minutes. You cannot turn your eyes away from one of these during an active trade.
- Only trade this strategy if you already know what you're doing — otherwise, you become someone else's liquidity.
I'm showing this because it's genuinely what my own process looks like, not because I'm suggesting anyone replicate it without real preparation.
I'll be straightforward about the limits, too: Finviz's charting tools are functional but basic compared to a dedicated charting platform, and its backtesting module only works on daily timeframes — fine for simple daily-bar rule testing, not for anything intraday. I use it specifically for the screener and premarket data, then move to a separate platform for actual chart analysis.
Finviz's free tier doesn't actually have a special name — it's just "Free." Unlike TradingView's free tier, which is branded "Basic" (covered on my TradingView page) — easy to mix the two up, and I did too at first. No signup required at all to start using Finviz's free tier. You get 60+ screener filters, heat maps, news, and basic charting — just with a 15-20 minute data delay, ads, and no real-time alerts, backtesting, or CSV export.
I get why the wall of subscription tiers across these tools feels intimidating at first — I felt the same way when I started. The free tier is genuinely good enough to learn the screener, build end-of-day watchlists, and figure out whether this is even something you want to commit money to before the data delay actually becomes a problem for you. There's no shame in starting there.
Card required to start the trial — see the note above before signing up.
The link above is an affiliate link — if you subscribe through it, I earn a commission on the subscription at no extra cost to you. I use Finviz Elite myself, daily, as described above. This isn't a paid placement; it's a tool I'd be recommending whether or not there were a commission attached.
Bullish Tools Trading LLC — Community Tool Resource · Last updated July 2026.